Product Support
How to Access the AXM-WEB Ethernet Module at User level
1. AXM-WEB Web Login Interface
To view the AXM-WEB web interface an Ethernet connection is needed.
-
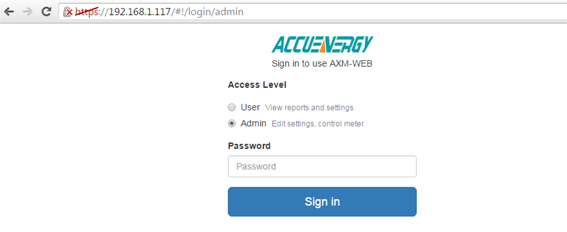
Open an internet browser and type in the IP address of the meter in the browser search bar and hit the Enter key. The meter's web login page will display as followed:

Figure 1
-
Login to the web page as 'User'. The default password is 'view'.
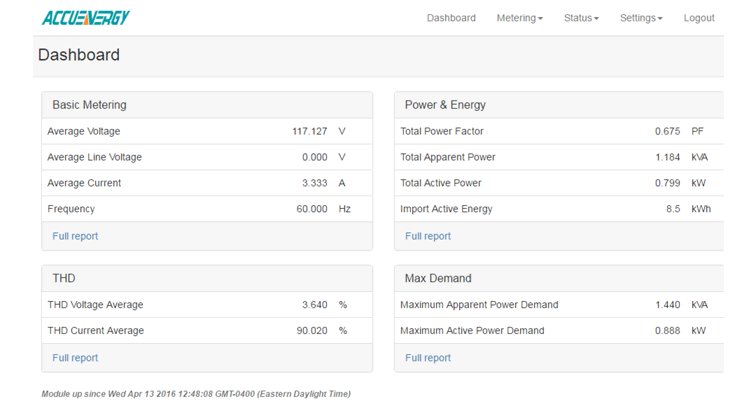
Upon successfully logging in you will be redirected to the Dashboard where a brief report of data from the meter will display. The Dashboard will also display how long the AXM-WEB has been up and communicating.

Figure 2
2. Metering Management
To view more data click on 'Metering'. This will display a list of parameters that can be viewed from the AXM-WEB. Click on the sub-section that corresponds to the data you would like to view:
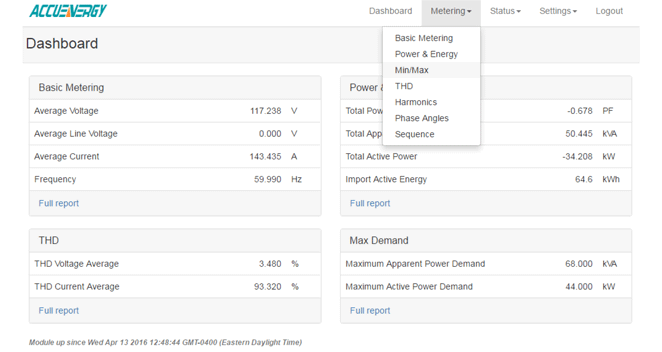
Figure 3
Basic Metering: This page will show the real-time readings such as voltage, current , power and etc.
Power & Energy: This page will show the energy readings such as the import energy, export energy, total energy as well as the demand readings.
Min/Max: This page shows the maximum and minimum statistics that the meter has recorded since the lifetime of the meter or from the last reset of the min/max statistics.
THD: This page will show the power quality data such as the THD, THFF, crest factor and etc. for both voltage and current.
Harmonics: This page will show the harmonics of the voltage and current waveform. It will display the harmonics of each phase in graphical and tabular format. Select between voltage and current to view their respective harmonics as well as between the 2nd-31st harmonics or 32nd-63rd.
Phase Angles: This page will show the phase angles of the voltage and current waveform.
Sequence: This page will show the positive, negative and zero components of the voltage and current waveform.
3. Status Management
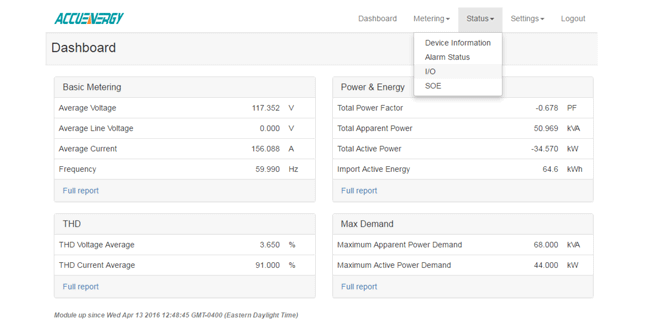
Figure 4
Device Information: This page will display meter information such as the model, serial number, firmware version and device address of the meter. It will also provide the serial number, firmware version, hardware version and MAC address of the AXM-WEB module.
Alarm Status: This page will display the alarm log of the meter. It will provide the status of up to 16 alarm events indicating the parameter, value and timestamp of the alarm event.
I/O: This page will show the status of the I/O Modules that are connected and their values. I.E. Relay Output status(on/off), DI status and etc.
SOE: This page shows the Sequence of Event log for the enabled I/O module with timestamps.

