How to Enable and Download a Datalog for the Acuvim II & AXM-WEB2
Proper energy meter configuration is essential to maximizing data accuracy and overall project success. At Accuenergy, we are committed to helping you set up your Acuvim II + AXM-WEB2 as quickly as possible so we’ve created a How To Video Series where we break down the setup process into easy-to-follow sections. Our short walkthroughs will teach you to efficiently navigate our web interface and get the most out of your metering devices.
Acuvim II + AXM-WEB2: How to Enable and Download a Datalog Using the Web Interface
The AXM-WEB2 can automatically log data in its onboard memory. The module supports three loggers for different parameters and requirements. Selecting which parameters to log and downloading the data file itself can be accomplished using the web interface.
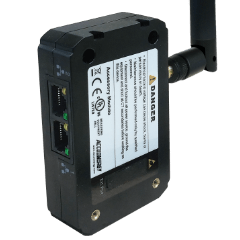
To complete these steps, you will need an Acuvim II meter with the AXM-WEB2 module powered up and connected to an internal network or the Internet plus the IP address of the device.
Step 1
Enter the IP address of the AXM-WEB2 module in your web browser. This will take you to the Accuenergy Login screen which prompts you for an Access Level and Password. Select "Admin" for the Access Level and enter the case-sensitive password for your module (default password: admin). Click the "Sign In" button.
Step 2
Upon logging in, you will be taken to the Dashboard screen. Click on " Settings" in the upper right corner and then the "Communications" tab to the left.
Step 3
Under "Communications," select the "Data Log" tab to open the logger configuration page.
Step 4
There are three data logs available. You may assign different parameters and post channels to each data log channel. Select "Enable" under each logger you wish to use to open additional configuration options.
Step 5
Next, scroll to the "Log Param Type" dropdown menu to select a parameter category. This will change which options appear in the "Not Selected" and "Selected" tables below.
- Parameters that are listed in the "Selected" table will added to the data log.
- If you do not wish to log a parameter, place it in the "Not Selected" table.
- Move parameters back and forth between tables by using the ">" and "<" buttons.
- Click "All" to move all parameters to the "Selected" table.
- Click "Clear" to move all parameters to the "Not Selected" table.
Step 6
Once parameter selections have been made, scroll down to the “Log Param Type Detail” section. This allows you to choose which parameter type to include in the data log by checking or unchecking the appropriate boxes.
- Note that Real-Time and Demand are the only parameter types that support Maximum and Minimum values.
Step 7
Next, select a "Timestamp Format" by clicking the appropriate radio button next to your choice.
Step 8
Under "Log File Name Format," select your preferred file format. The file can either include a UTC Timestamp or the Time Interval.
Step 9
The next five dropdown menus allow for further file customization:
- Log Interval: Select the interval for logging data.
- Log File Length: Select the interval for each data log.
- Log File Name Prefix: Choose a prefix to add to each file name such as a device name or location.
- Local Log File Length: Select the interval for uploading all local data log files.
- Local Log File Name Prefix: Change the local file name prefix in this field.
Step 10
When configuration is complete, click the green "Save" button. For the settings to take effect, the module must be rebooted. You will be prompted to either "Reboot Now" or "Reboot Later." If "Reboot Later" is selected, the module must be rebooted from the "Management" page.
Step 11
If "Reboot Now" is selected, the module will begin the reboot process right away. Click the "OK" button to log out from the web interface.
Step 12
The reboot process takes 1-2 minutes. Once the process is complete, you may log back in again to confirm the settings have taken effect. Follow the same login process outlined in Step 1.
Step 13
To find your data files in the web interface, click "Logs" and select "Data Log" from the dropdown menu.
Step 14
To download a data file, click the download icon ( next to the file you are interested in. This will open an operating system dialog box; navigate to the location on your hard drive where you would like to save the file and click Save.
Step 15
After the file is saved, you may log out again. This completes the process for enabling and downloading a data log file.
For more information on configuring the Acuvim II + AXM-WEB2 module, visit our Video Guide page or Contact Us.