Product Support
Reading Acuvim L Meter Data with AcuView Software
View Voltage, Current and Power Data
From the left navigation panel click on the "Readings" tab and then click on "Real-Time Metering" to view real time data such as voltage, current, power etc.
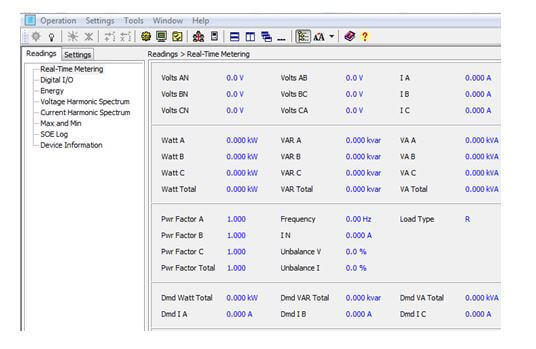
Figure 1: Real-Time Metering Readings
View the Digital Input Status
From the left navigation panel click on "Readings" tab and then on "Digital I/O" to view the DI and DO data.
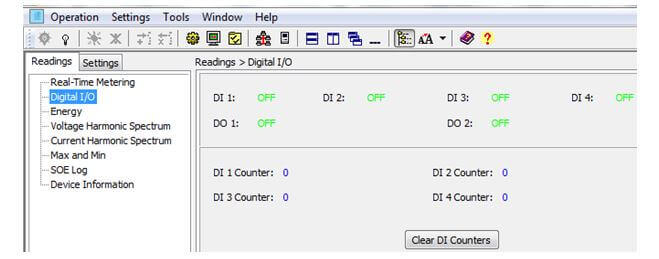
Figure 2: Digital Input Status
View Energy Readings
From the left navigation panel click on the "Readings" tab and then on "Energy" to view different energy readings such as Energy consumed (Ep_imp), Energy generated (Ep_exp), as well as pulse input information etc.
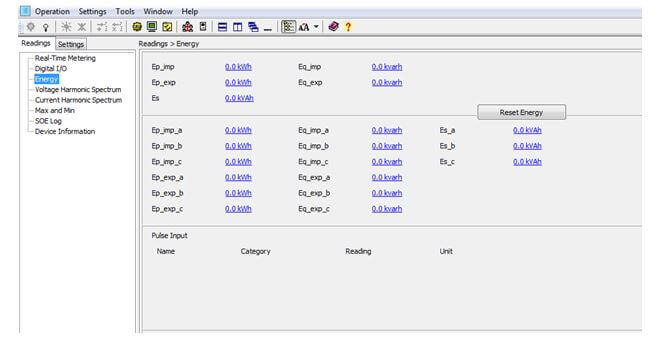
Figure 3: Energy Readings
For the Acuvim EL meter, click on "Readings" tab, then on "Energy" and then on:
- "Real-Time" to view different energy readings.
- "Current Month TOU" to view the TOU energy and demand for the current month.
- "Prior Month TOU" to view the TOU energy for the previous month.
View Voltage and Current Harmonics Spectrum
To view the Voltage Harmonics Spectrum:
- From the left navigation panel click on the "Readings" tab and then on "Voltage Harmonic Spectrum" to view the voltage THD, as well as the voltage harmonic spectrum.
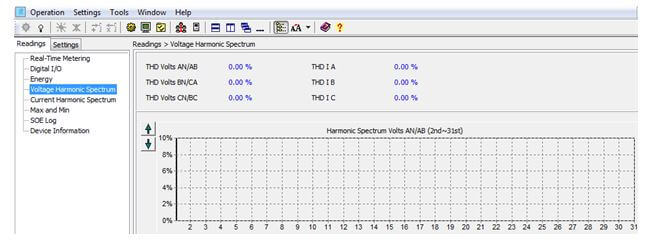
Figure 4: Voltage Harmonics Spectrum
To view the Current Harmonics Spectrum:
- From the left navigation panel click on the "Readings" tab and then on "Current Harmonic Spectrum" to view the current THD, as well as the current harmonic spectrum.
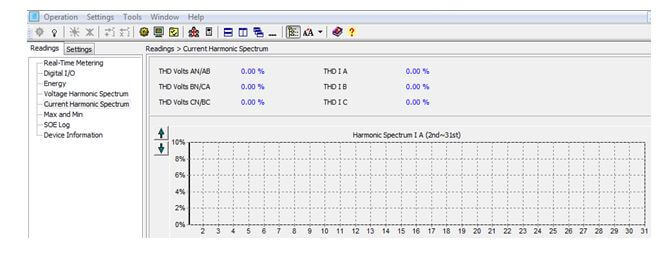
Figure 5: Current Harmonics Spectrum
View Max / Min Statistics
From the left navigation panel click on the "Readings" tab and then on "Max and Min" to view the maximum and minimum values for different parameters. You can also reset or save the max and min information.
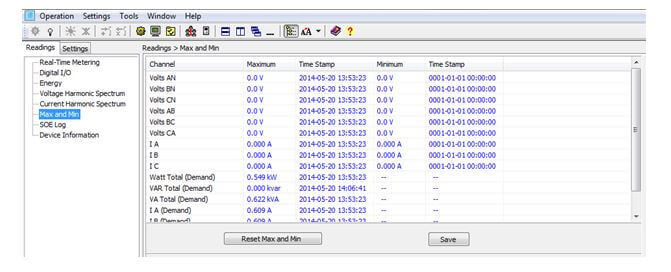
Figure 6: Max/Min Statistics
View SOE Log
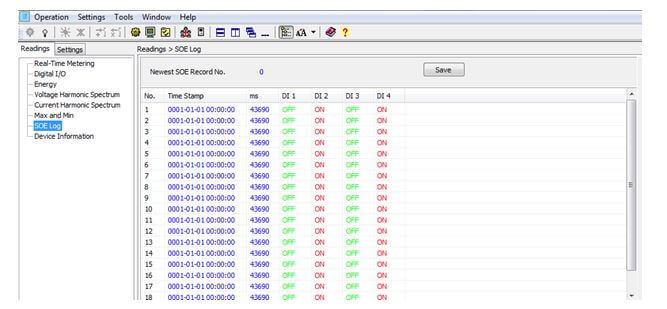
Figure 7: SOE Log
View Acuvim L Device Information
- From the left navigation panel click on the "Readings" tab and then on "Device Information" to view information such as the device type, hardware and software version of the meter.
- The Device Clock can be viewed and set in this section.
- Load Run-Time and Device Run-Time can be cleared as well.
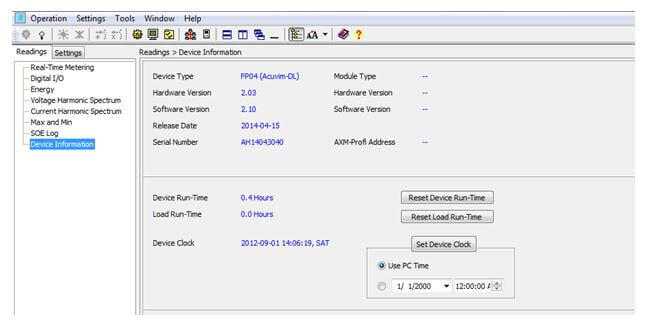
Figure 8: Device Information
